


Welcome to my world
Hi, I’m Riaz Ahmed
Hi, I’m Riaz Ahmed
a
Data Analyst
Power BI Specialist
SQL Specialist
Sr. Mechanical Engineer
R&M Expert
SAP PM/MM
A seasoned Mechanical Maintenance & Reliability Engineering Specialist with over 19 years of experience in multinational oil and gas organizations. Expert in managing static and rotating equipment, leading maintenance operations, and executing capital projects aligned with OSHA and PSM standards. Skilled in RCM, RCA, FMEA, RBI, and reliability modeling, with hands-on expertise in using data analytics and dashboards to optimize plant performance, asset health, and KPIs. Holds an MSc in Mechanical Engineering and is currently enhancing expertise through a Data Analyst Professional Certification (Excel, Power BI, MySQL, Tableau, Python, AI) to integrate data-driven insights into maintenance and reliability strategies.


Features
What I Do
Data Analyst
I possess strong skills in data analysis, including the ability to collect, analyze, and interpret large datasets to extract actionable insights. My expertise extends to statistical techniques and programming languages such as SQL and Python, enabling me to conduct thorough analyses and derive meaningful conclusions. Additionally, I am proficient in utilizing data visualization tools to present findings in a clear and concise manner, facilitating effective communication of insights to stakeholders.
Business Intelligence
With experience as a Business Intelligence Specialist, I have honed my ability to transform raw data into valuable insights that drive strategic decision-making within organizations. My proficiency lies in data modeling, reporting, and dashboard creation, allowing me to provide comprehensive business insights to stakeholders at all levels. I am adept at leveraging various tools and technologies to ensure the delivery of actionable insights that contribute to organizational success.
Power BI Specialist
As a Power BI Specialist, I excel in utilizing Microsoft Power BI for data visualization and analysis purposes. My skills include designing interactive dashboards, creating robust data models, and performing advanced analytics to empower users with intuitive reports and visualizations. By leveraging Power BI, I facilitate informed decision-making processes across the organization, enabling stakeholders to gain valuable insights into business performance and trends.
Visit my portfolio and keep your feedback
My Portfolio

The Situation:
Adventure Works is a fictional global manufacturing company that produces cycling equipment and accessories, with activities stretching across three continents (North America, Europe, and Oceania). Our goal is to transform their raw data into meaningful insights and recommendations for management. More specifically, we need to:
- Track KPIs (sales, revenue, profit, returns)
- Compare regional performance
- Analyse product-level trends
- Identify high-value customers
The Data:
We’ve been given a collection of raw data (CSV files), which contain information about transactions, returns, products, customers, and sales territories in a total of eight tables, spanning from the years 2020 to 2022.
The Task: We are tasked with using solely Microsoft Power BI to:
- Connect and transform/shape the data in Power BI’s back-end using Power Query
- Build a relational data model, linking the 8 fact and dimension tables
- Create calculated columns and measures with DAX
- Design a multi-page interactive dashboard to visualize the data in Power BI’s front-end
The Process:
1. Connecting and Shaping the Data
Firstly, we imported the data into the Power Query editor to transform and clean it. The next process involved:
Removing Duplicates: Duplicate entries were removed from the dataset to ensure accurate analysis.
Handling Null or Missing Values: For some columns, missing values were replaced with defaults or averages. Null values in “key” columns were removed using filters.
Data Type Conversion: Columns were converted to appropriate data types to ensure consistency. Dates were converted to Date type, numerical columns to Decimal or Whole Numbers, and text columns to Text.
Column Splitting and Merging: Several columns were split to separate concatenated information, or merged to create a unified name (such as Customer Full Name).
Standardising Date Formats: All date columns were formatted consistently to facilitate time-based analysis. This step was important for ensuring accurate time-series analysis in Power BI.
Removing Unnecessary Columns: Irrelevant columns were removed to streamline the dataset. This helped focus the analysis on relevant information, reducing memory usage and improving performance.
2. Building a Relational Data Model
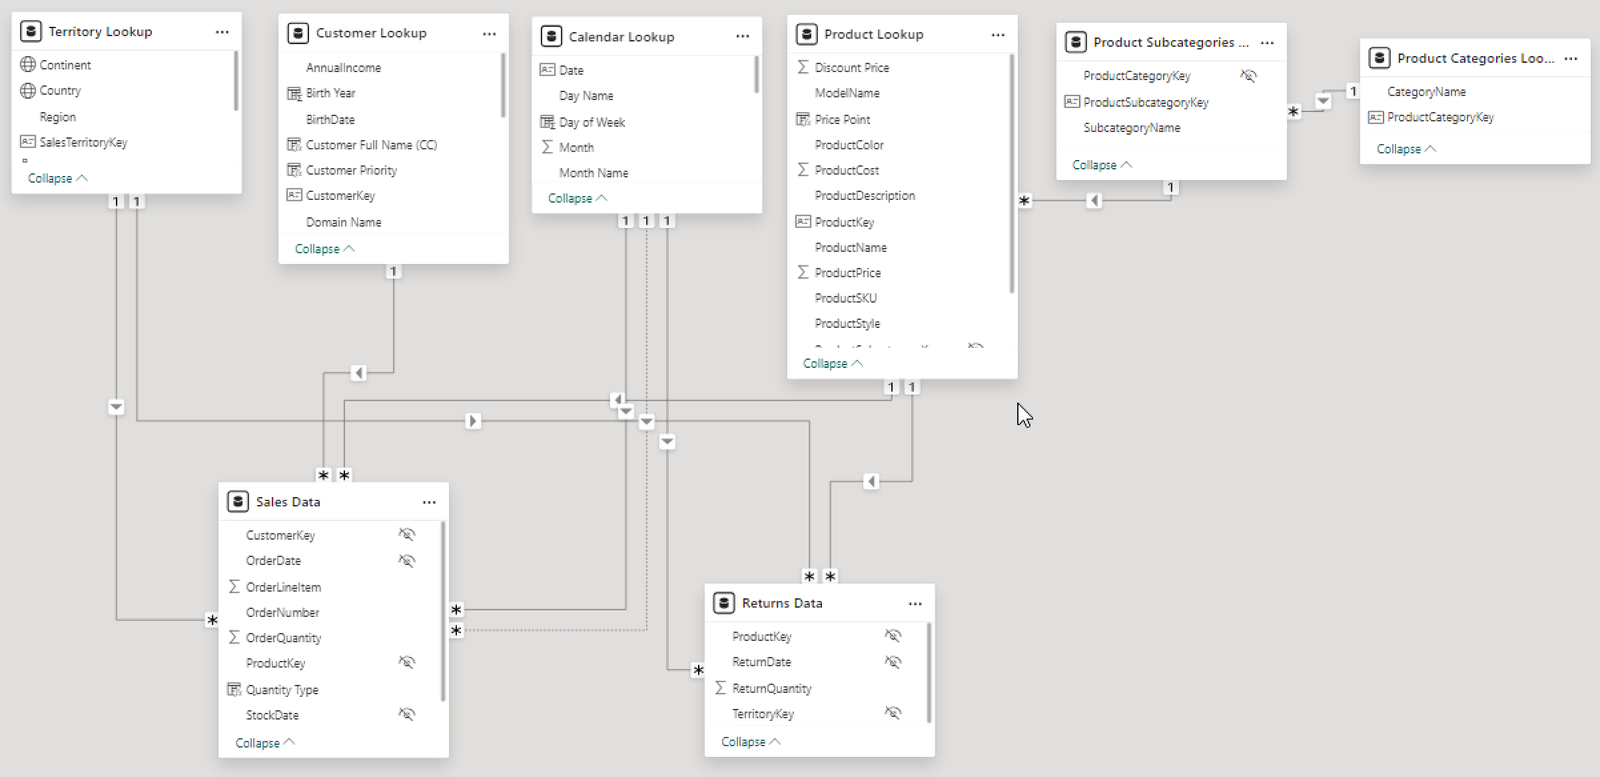
Secondly, we modeled the data to create a snowflake schema. This process involved creating relationships between the dimension and fact tables, ensuring cardinalities were one-to-many relationships.
Enabling active or inactive relationships, creating hierarchies for fields such as Geography (Continent-Country-Region) and Date (Start of Year-Start of Month-Start of Week-Date), and finally hiding the foreign keys from report view to ease the data analysis and visualization steps and reduce errors.
3. Creating Calculated Columns and Measures
Next, we used Power BI’s front-end formula language, DAX, to analyze our relational data model and create several calculated columns (for filtering) and measures (for aggregation), that we could later reference and use when analyzing and visualizing the data.
We used calculated columns to determine whether a customer is a parent (Yes/No), a customer’s income level (Very High/High/Average/Low), a customer’s priority status (Priority/ Standard), and the customer’s educational level (High School/ Undergrad/ Graduate).
The list of calculated measures is available below and includes key information on revenue, profit, orders, returns, and more.

4. Visualising the Data
The final step of the project was creating a multi-page interactive dashboard, including a range of visuals and KPIs that could serve management and lead to informed decision-making. We used several visuals and tools to demonstrate and visualize the data across the 4 report pages, including KPI cards, line and bar charts, matrices, gauge charts, maps, donut charts, and slicers. We made sure the report was fully interactive and simple to navigate, with icons used to enable filters, cancel filters, and guide users to each report page with ease. Features such as drill-through, bookmarks, parameters, and tooltips were also used throughout the dashboard, further enhancing its usefulness and impact on management.
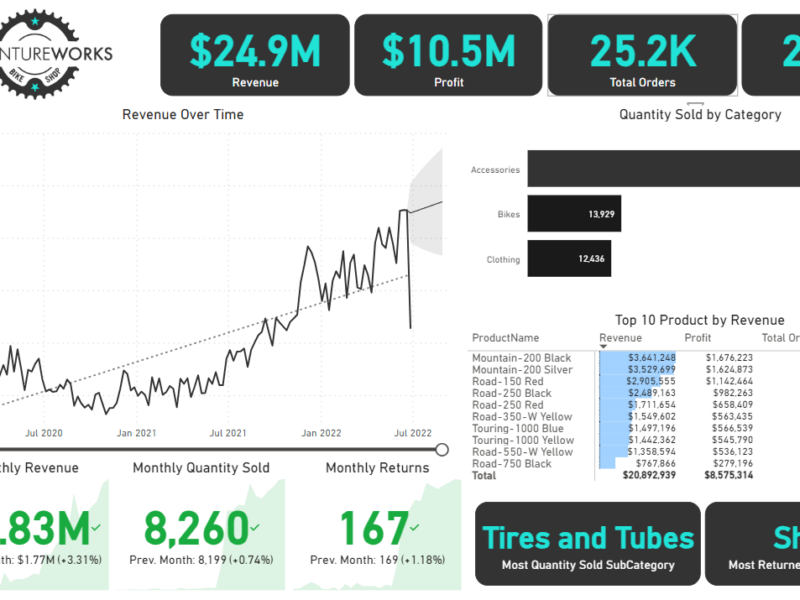
Executive Dashboard: The first report page provides a high-level view of Adventure Works’ overall performance. We used card visuals to present Key Performance Indicators such as overall revenue, profit margins, total orders, and return rates. We also included additional cards to compare current and previous month performances, providing insights into recent trends, a line chart to visualize the trending revenue from 2020-2022 and highlight long-term performance, and presented the number of orders by product category to aid in understanding product sales distribution, and used a further table to display the top 10 products based on key indicators (total orders, revenue, and return rate).

Map: The second report page consisted of a map visual, an interactive representation of sales volume across different geographical locations. This offered insight into Adventure Works’ global sales distribution and worldwide reach.

Product Detail: The third report page focuses on detailed product-level analysis. It displayed detailed product information for the selected top 10 products from the Executive Dashboard, using the drill-through feature. It also included gauge charts presenting actual performance vs target performance of monthly orders, revenue, and profit, and included an interactive line chart to visualize potential profit adjustments when manipulating the price of the product, aiding in strategic decision-making regarding pricing strategies. This report page also included a line chart including key weekly product information on total orders, revenue, profit, returns, and return rate.

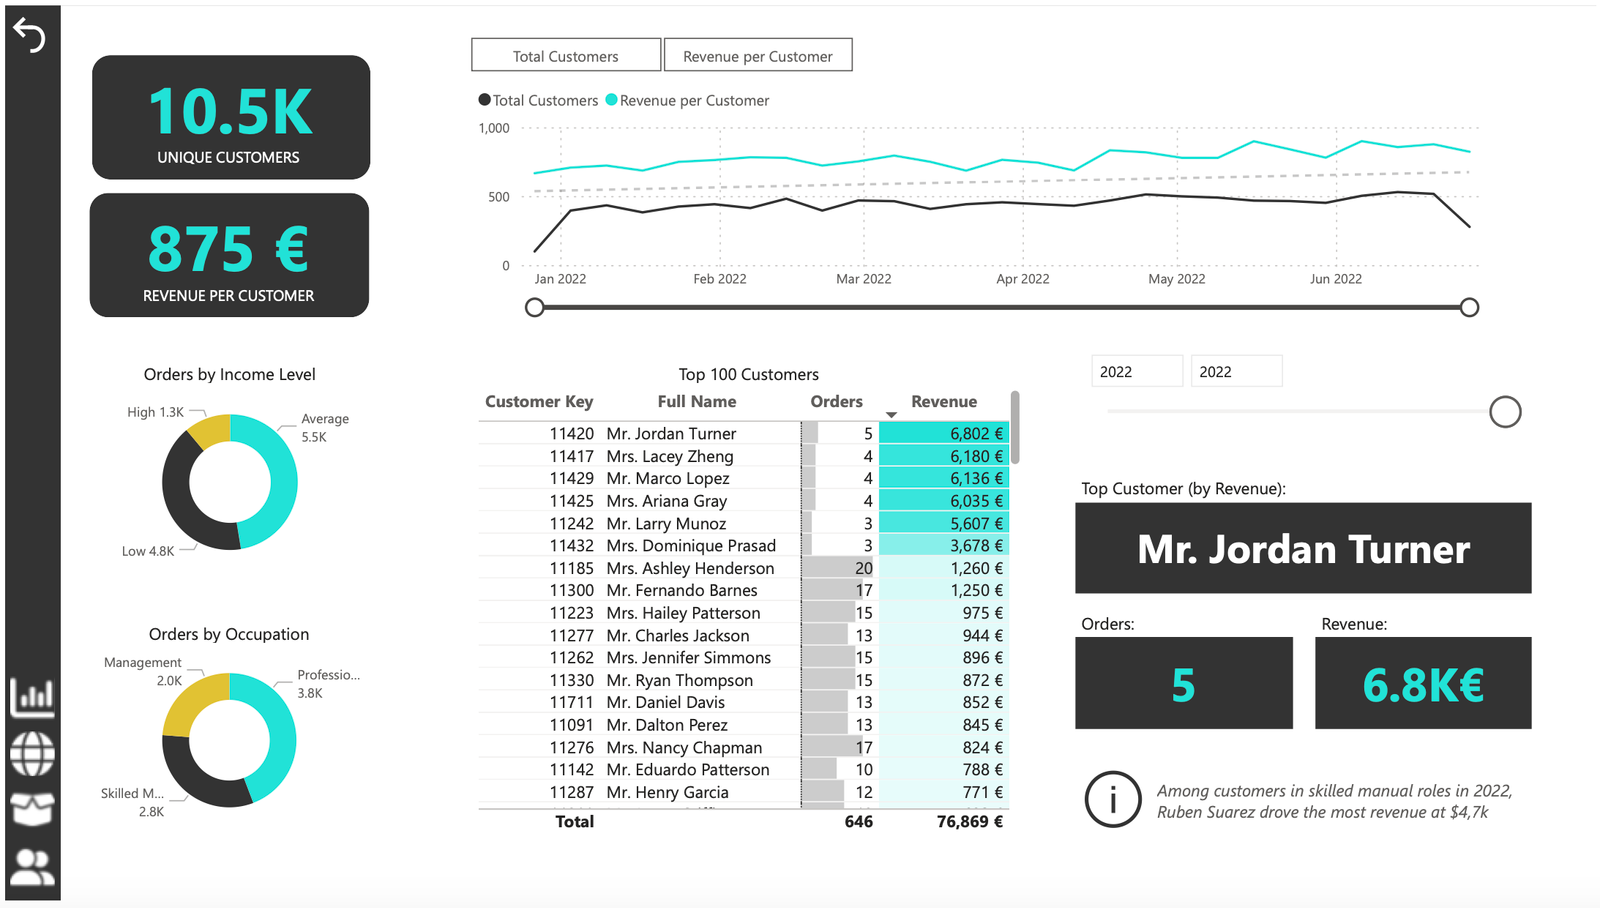
Customer Detail: The fourth and final report page provided a deeper insight into customer behavior and value. It used donut charts to break down customer groups into income level and occupation categories vs. total orders, helping in customer segmentation tactics, and used a matrix aided by KPI cards to identify high-value customers based on order and revenue contributions, aiding in identifying high-value customers and sales opportunities.
22+ Years of Experience
My Resume
2003 - Present
Experience Background
Senior Mechanical Engineer (Kandhkot Gas Field)
Pakistan Petroleum Limited (Jul 2016 - Present)
KARACHI
- Implemented preventive and predictive maintenance strategies, contributing to a 95% reliability rate by using reliability tools. - Completed an in-house major overhaul of three Siemen HP Centrifugal Compressors STC-SV (10-7-B) of TUCO-A, B & C. - Performed replacement of Gas Generators and packages of Siemen SGT-400 (Twin Shaft) Gas Turbines (TUCO - A, B & C). - Increased condensate oil production up to 3000 barrels/year by upgrading the plant`s liquid handling facilities. - Completed Annual Turnaround as per API 510 of Gas Dehydration Units (DHU # 3, 4 & 5) up to the capacity of 360 MMscfd. - Uploaded plans of gas dehydration and compressions facility & allied utilities, powerhouse, wells pipelines & valves assemblies etc. - Overhauled gas engines Caterpillar G-3508, Waukesha P48GSI, Cummins QSV-91G2 & Komatsu Diesel Engine EG-175 & 220. - Successfully replaced DE & NDE Dry Gas Seals of Siemen HP Centrifugal Compressors STC - SV (10-7-B) of TUCO-A, B & C. - Involved in planning and executing maintenance of plant machinery to ensure the uninterrupted supply of gas. - Ensuring full compliance with all relevant health and safety standards and procedures.
Maintenance Engineer (Kandhkot Gas Field)
Pakistan Petroleum Limited (Apr 2010 - Jun 2016)
KARACHI
- Successfully led the engineering department including maintenance operations, integrity asset management, modifications, RCA, reliability, troubleshooting and data analysis of all equipment & installations. - Effectively headed the technical review of mechanical integrity aspects of the management of the change process. - Successfully managed gas compression plant, dehydration plant, condensate recovery system, power generation engines and gas pipeline maintenance projects, etc. - Increased equipment availability, reduced operational losses, and achieved set standards by implementing solutions. - Effectively reviewed lube oil condition reports and generated recommendations for corrective actions. - Supported various programs using prediction planning tools to include the calculation and analyzed data of rotary equipment. - Performed inspection and QA/QC related job for pressure vessels as per API 510 and tanks as per API 653 codes. - Prepared and monitored department budget (Capex, Revex) and also the scope of work and contracts for different maintenance jobs through contractors in the SAP system. - Efficiently utilized resources, inventory, budget and ensured full compliance with environmental and safety regulations. - Ensured all technical and company standards were met.
Field Engineer (SP2)
Bridgestone Europe NV/SA (Oct 2008 – Apr 2009)
Brussels, Belgium
- Created and introduced new product concept after thorough research in a timely manner in line with corporate strategy. - Effectively monitored & analyzed quality data, market information to improve the existing process. - Successfully created a system for easy follow up after shortcoming inspections for product evaluation. - Played an important role in the planning of IAA Hannover 2008 and concluded a summary of vehicle size trends and share. - Successfully identified the main causes of tires underperformance by evaluating and analyzing data from the 2008 survey. - Performed evaluation of TBR: 65 series (RTD) Level and identified the main removal reason and visual aspect. - Accurately analyzed claims and approached the EWS through data analysis and quality improvement activities. - Performed trailer OE market analysis for future business development and inspected TBR for quality assurance. - Provided technical support, service and training to subsidiary sales companies.
Site Engineer
CPECC – Techno Consortium (Mar 2003 - Aug 2006)
KARACHI
- Successfully completed various site activities at Camp 2 Dadu conforming to B31.4, B13.8, API-1104, API-1102, Sa – 2 1/2. - Completed construction, installation and commissioning of two & six above-ground storage tanks at PARCO Port Qasim & Mehmood Kot Terminal Stations respectively conforming to API-650. - Supervised the site construction & QC activities including trenching, stringing, welding, etc. of 26” Dia underground pipeline. - Performed supervision of site activities i.e. construction, QA/QC, installation and commissioning of fixed roofs above ground petrol & HSD oil storage tanks at Port Qasim and Mahmood Kot Terminal Stations. - Supervised welding teams, QC team and other 100-150 staffs responsible for executing tanks and pipeline construction, installation and commissioning work at Port Qasim and Mahmood Kot Terminal Stations, Camp-2 (Dadu). - Prepared work plans quality inspection plans and performed a risk assessment of construction / QC jobs. - Adhered to established policies and procedures and ensured compliance with all safety and environmental regulations. - Ensured timely preparation and submission of each project report to the senior management. - Effectively identified various technical issues and suggested fixes and improvements as needed. - Accurately documented and recorded technical issues and solutions.
2003 - 2008
Education Background
MSc in Mechanical Engineering
KTH Royal Institute of Technology (2008)
SWEDEN
BE in Mechanical Engineering
Mehran University of Engineering & Technology (2003)
PAKISTAN
Features
Soft Skill
Leadership & Strategic Planning
100%
Training and Development
95%
Teamwork and Coordination
85%
Recruiting & Onboarding
85%
Communication & Presentation
100%
Features
Technical Skill
STATISTICS
100%
MICROSOFT EXCEL
95%
POWER BI
90%
STRUCTURED QUERY LANGUAGE SQL
90%
PYTHON
80%
2013 - 2025
Certifications
Professional Data Analyst Certification Program
Analytix Camp (Apr 2025 – Nov 2025)
KARACHI
1. Proficient in Excel: Demonstrated ability to manipulate data, perform complex calculations, create pivot tables, and generate insightful visual.
2. Power BI Specialization: Capable of designing interactive dashboards and reports to visualize data trends and patterns, enabling stakeholders to make informed business decisions..
3. Proficient in SQL: Profound understanding of SQL querying language, adept at extracting and manipulating data from relational databases to conduct thorough data analysis and generate meaningful insights.
4. Strong foundation in Statistics: Possess a solid grasp of statistical concepts such as hypothesis testing, regression analysis, and probability theory, enabling accurate interpretation of data and formulation of data-driven recommendations.
5. Competent in Python: Proficient in utilizing Python programming language for data manipulation, analysis, and visualization tasks, leveraging libraries such as Pandas, NumPy, and Matplotlib to derive actionable insights from diverse datasets.
6. Comprehensive understanding of Data Analysis Methodologies: Equipped with a holistic understanding of various data analysis techniques and methodologies, including exploratory data analysis (EDA), and regression analysis, to extract actionable insights and drive business growth.
7. Effective Communication and Presentation Skills: Able to effectively communicate complex analytical findings to diverse stakeholders through clear and concise reports, presentations, and visualizations, facilitating informed decision-making processes across organizational levels.
Verification Link: Riaz Ahmed Khaskheli Certification - Analytix Camp
Dry Gas Seal “Sealing System Training”
Engro Fertilizer (2018)
KARACHI
Incident Investigation Leadership (Root Cause Analysis, etc.)
(2017)
KARACHI
API-510 Pressure Vessels Design, Fabrication, Inspection, Flaw Evaluation and Repair
(2017)
KARACHI
Corrosion Fundamentals, Types, Causes, Analysis and Corrosion Failures
(2016)
KARACHI
Reliability Centered Maintenance
(2016)
KARACHI
Material Master Data Management
IHS Struxure (2015)
DUBAI
SAP MM Continuous Improvement Projects (MM_WKS_DE_01)
(2013)
KARACHI
SAP PM (PM_WKS_DE_07)
(2013)
KARACHI
Total Asset Integrity Management System
(2013)
KARACHI
What Clients Say
Testimonial

ANALYTIX CAMP
Muhammad Abbas
Chief Executive OfficerData Analytics Project Development
via Fiverr - Apr, 2025 - Nov, 2025I am pleased to commend Riaz Ahmed for his exceptional dedication, professionalism, and achievements. He consistently demonstrates a strong work ethic, intellectual curiosity, and enthusiasm for learning, contributing positively to our academic and professional environment. Riaz approaches every challenge with determination and integrity, while his supportive and collaborative nature inspires those around him. His commitment to excellence, leadership qualities, and positive attitude reflect his potential for continued success and make him a valuable asset to any team or organization.
Contact
Contact With Me
